Defining Holistic Asset Criticality to Manage Risk
By David J. Mierau, PE, CMRP Life Cycle Engineering
As published in Pharmaceutical Engineering Magazine
The pharmaceutical and biotech industries have a wealth of information published related to risk-based practices for validation, qualification and commissioning of processes and equipment. However, these approaches typically focus exclusively on the impact of an asset to product or raw material SISPQ (strength, identity, safety, purity, and quality). While this is an appropriate focus area for making medicines and vaccines, there is significant business value in understanding the holistic potential impact an asset carries.
Successful pharmaceutical and biotech operations share the same foundation as other manufacturing operations: safety, quality and productivity. People within an organization utilize established processes (e.g. procedures, standards, programs, etc.) to achieve a stable asset performance level. As an example: Manufacturing Production Planners utilize their current Sales and Operations Plan to create a base schedule for Operations, so that customer orders can be met and desired inventory levels are maintained. Having some balance across all three areas of safety, quality and productivity is necessary – take away one of these aspects and the operation will not be successful. Pharmaceutical and biotech operations typically have robust quality and process safety management (PSM) systems, but have not developed equally valuable productivity systems.
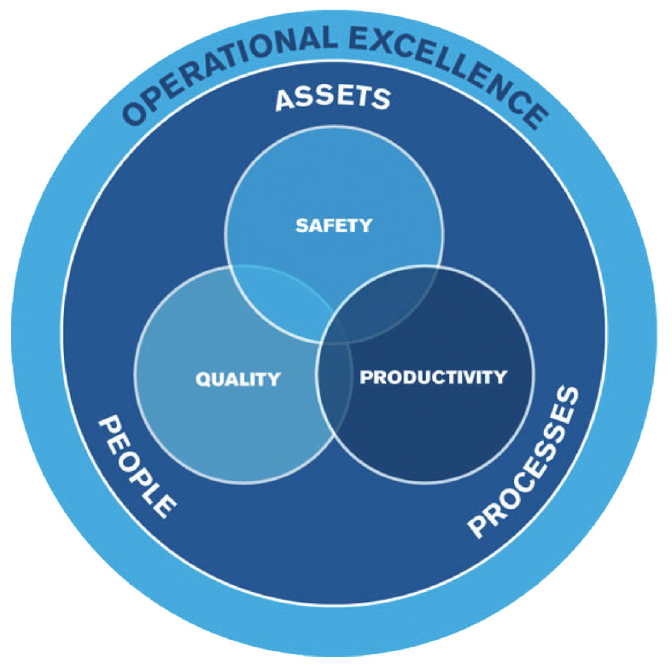
Figure 1 – Key Aspects of Operational Excellence
Understanding and quantifying how each of these areas specifically impacts the overall operation is the genesis of developing a Risk-based Asset ManagementSM program which maximizes productivity while maintaining focus on safety and quality. The ultimate goal of this program is to achieve operational stability and compliance through asset risk control strategies that mitigate known risks. An example of an asset risk control strategy related to safety would be conducting predictive maintenance (e.g. vibration measurement and analysis) for a process cooling water circulation pump to ensure the pump does not unexpectedly fail and allow an exothermic process to overheat. This also has operational benefit through preventing the unexpected failure and associated downtime to repair the failed pump.
Figure 2 outlines a process that starts with a list of site assets and progresses through creation of specific asset risk control strategies.
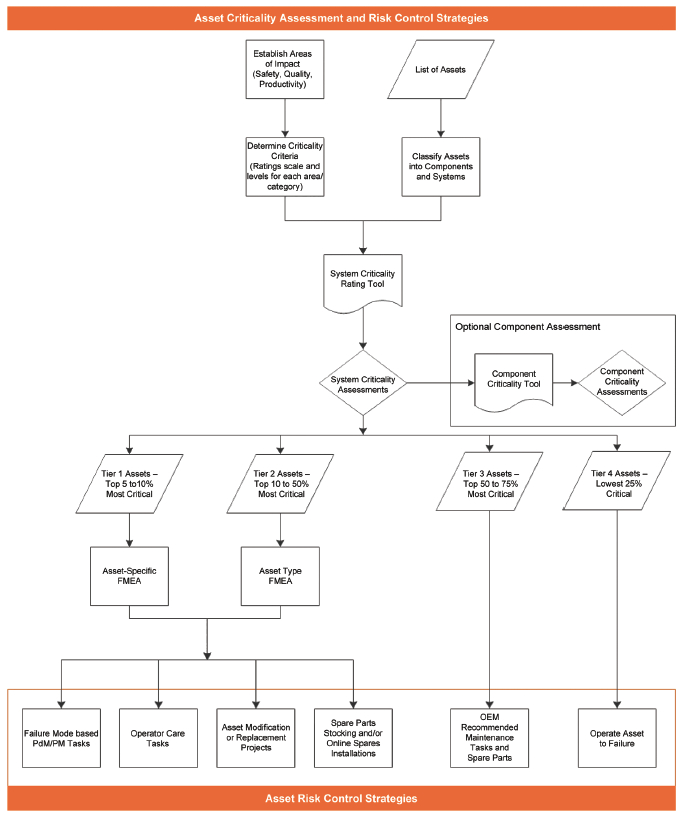
Figure 2 - Process for Managing Risk through Asset Criticality Assessments
Establishing Impact Criteria and Methodology
In order to determine which assets are critical to the operation, impact criteria must be developed that specifically relate to the operation. Each asset will be evaluated for all categories chosen, and therefore the categories should be limited to allow for feasible execution, but still capture an accurate assessment of overall criticality.
Health, Safety and Environmental Criteria
impact criteria that relate to personnel health and safety include a potential first aid injury, an OSHA recordable injury, a fatality or multiple fatalities. Environmental criteria can be categorized by potential on-site release/spill below reportable quantity (RQ), on-site contained release above RQ, uncontained release above RQ, release that affects vegetation or waterways off-site. Additional criteria for health, safety, and environmental impact assessment can be found within the published CCPS Guidelines for Risk Based Process Safety.
Quality Criteria
The ISPE Baseline Guide for Commissioning and Qualification is an industry-recognized resource that provides criteria for determining potential impact to quality and is summarized as follows:
- Direct Impact to Quality:
- The system has direct contact with the product (e.g. air quality)
- The system provides an excipient, or produces an ingredient or solvent (e.g. water for injection)
- The system is used in cleaning or sterilizing (e.g. clean steam)
- The system preserves product status (e.g., nitrogen)
- The system produces data which is used to accept or reject product (e.g. electronic batch record system, or critical process parameter chart recorder)
- The system is a process control system (e.g., PLC, DCS) that may affect product quality and there is no system for independent verification of control system performance in place - Indirect Impact to Quality:
- The system supports a direct impact system or function (e.g. tank jacket process cooling water) - No Impact to Quality:
- The system does not meet any of the criteria for Direct or Indirect Impact to Quality (e.g. administrative facilities)
Productivity Criteria
A thorough understanding of the operational value stream is required to determine the potential impact of an asset to productivity and the business. Specific stages of a process may include cost-intensive manufacturing steps or a significant quantity of product. Capturing the impact to the profit plan is the most direct measurement of business impact, based on actual monetized loss. For some operations, a significant impact to their profit may be $100,000 while for others a significant impact may be $10,000,000 or more.
Other Factors of Criticality
Customer Impact: The potential for a delayed delivery, loss of a sale, loss of a customer, or brand impact.
Strategic Plan Impact: An asset manufacturing or storing a product that is critical to the business strategy and long-range plan.
Asset Reliability: The failure rate of a specific asset categorized as one failure per day, week, month, quarter, year, etc.
Maintainability: The mean time to repair (MTTR) an asset and put it back in service categorized as less than a day, several days, one week, several weeks, or possibly months. This category will factor in spare parts availability in addition to serviceability.
Utilization: Establishing whether the asset is fully utilized 100% of available operating hours, or only utilized 10% or less. Also, a specific functionality may be needed 100% during operation, but parallel assets (online spares) can reduce each individual asset to 50% or less utilized.
Single Point of Failure: Identify whether or not the asset has a continuity or contingency plan in place.
Replacement Cost: Categorizing specific asset replacement costs to identify where unique technology and significant replacement risks exist within the value stream.
Decommissioning: Biological compounds and allergens may require resource intensive decommissioning efforts and therefore present a higher risk to the operation.
Classifying Assets
It is most common to start with a list of all site assets from the computerized maintenance management system (CMMS), the enterprise asset management system (EAM) or the financial system. Site walk-downs should be conducted to compare the asset listing and drawings to actual field conditions. Updating the asset listing at an early stage will allow for efficient use of time during subsequent criticality assessments.
While written for the petroleum and natural gas industries, ISO Standard 14224 provides relevant guidance for establishing asset taxonomy or relational structure. The most common structure is a parent-child hierarchy. At a minimum, the site should establish a list of lowest maintainable components (ISO 14224 Taxonomy Level 8), and group these into equipment units or subunits (ISO 14224 Taxonomy Level 6 & 7); reference Figure 3 for the complete pyramid of hierarchy levels. Most operations will have thousands of maintainable components, and combining these into several hundred groups of assets (systems) or less will allow for a more reasonable initial execution of criticality assessment.
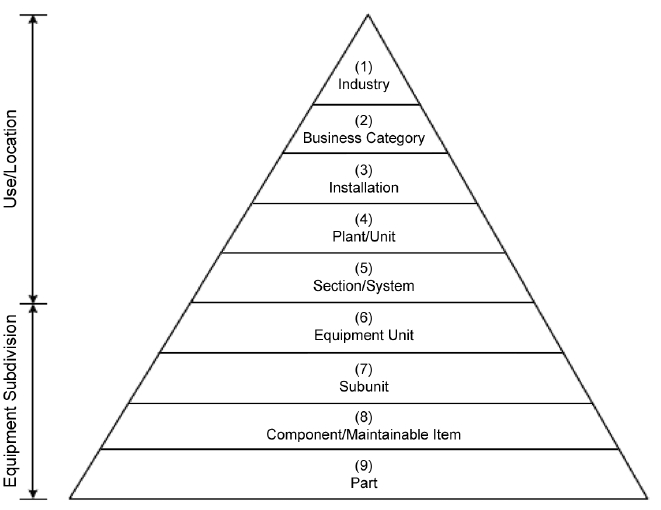
Figure 3 - Taxonomy from ISO Standard 14224
Criticality Assessments
Conducting asset criticality assessments requires a spreadsheet or database tool that can combine the large list of assets and the category rating criteria. Also, averaging, weighting and sorting are key functional requirements of the rating tool; reference Figure 4 for an example.
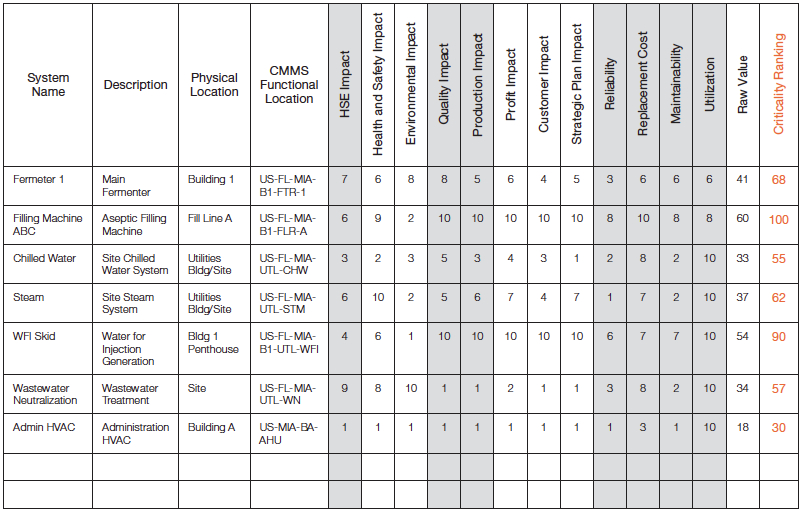
Figure 4 – Criticality Assessment Rating Tool
After uploading the list of assets to the rating tool, each category is considered for potential impact from a most probable failure mode, or set of failures. Catastrophic events such as natural disasters would typically not be considered during the analysis, but significant failures related to each asset should be. Similar to conducting a PSM process hazard analysis (PHA), the designed asset layers of protection and likelihood of occurrence should be taken into consideration concurrent with the severity of impact.
If a numerical 1-10 scale is used within the rating tool, each category aligns criteria across this range. For example, the category of Utilization may have a range as follows:
- 10 = 100% Utilized
- 9 = 90% Utilized
- 8 = 80% Utilized
- 7 = 70% Utilized
- 6 = 60% Utilized
- 5 = 50% Utilized
- 4 = 40% Utilized
- 3 = 30% Utilized
- 2 = 20% Utilized
- 1 = <10% Utilized
For Quality impact ratings, the following may be used:
- 10 = Final Drug Product Direct Impact
- 8 = API Direct Impact
- 5 = Indirect Impact
- 1 = No Impact
Note: If your operation manufactures both API and final drug product, you may choose to have a lower level of impact for API Direct Impact systems, assuming there are purification steps at the beginning of final drug product processing. This elevates assets directly involved with final drug product manufacturing, where typically purity and sterility are of higher importance.
An alternative Quality impact rating scale could incorporate potential impact of an asset on a product’s critical quality attributes (e.g. safety, identity, strength, purity, quality). For example, if a system has the potential to introduce a contaminant or bioburden to the process that is not removed downstream, this could directly impact patient health. For this approach, the following is an example of Quality impact ratings:
- 10 = Product contamination or lack of efficacy that could impact patient health
- 9 = Product contamination or lack of efficacy that would lead to internal (corporate supply chain) quarantine
- 8 = Repeat manufacturing deviation from validated process
- 7 = Manufacturing deviation from validated process
- 1 = No impact to quality
Note with this rating scale it may be appropriate to “weight” the criteria scores due to the extremely high impact potential on patient health and the business.
The goal of criticality rating is to obtain a balanced value across all impact criteria categories. Therefore, if several categories are related, they should be averaged as subcategories under a broader heading. For example, profit plan, customer impact, and strategic plan impact all relate to the overall business or productivity category, and are averaged in the example provided in Figure 4 to provide one score for the production impact. Ultimately, each operation must decide what the category balance or weighting should be. Each of the main categories are then added or multiplied together to obtain a balanced criticality “Raw Value”, and the final Criticality Ranking can be normalized to a 100 or 1,000 scale.
A best practice is to conduct criticality assessments for all assets at ISO 14224 Taxonomy Level 6 and 7, and then continue to evaluate each component level asset. This ensures that assets rated as non-critical or quality no impact, do not have any critical or quality direct impact components. It also identifies specific component-level assets that are highly critical to the overall operation, and therefore should have specific asset risk control strategies developed.
Creating Asset Risk Control Strategies
Upon completion of criticality assessments, a distribution of ratings typically resembles a bell curve or slightly skewed bell curve; Figure 5 is an example.
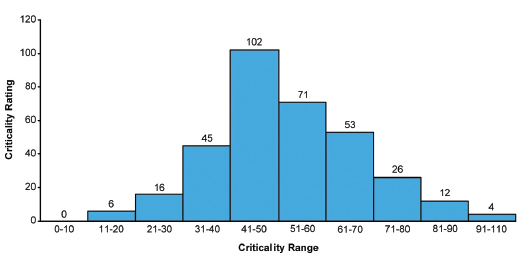
Figure 5 – Criticality Ratings Distribution Example
Further grouping of the ranges into tiers pulls together groups of assets with similar criticality ratings:
- Tier 1 – Highly Critical: Top 5-10% of all rated assets
- Tier 2 – Moderately Critical: Top 10% - 50% of all rated assets
- Tier 3 – Low Critical: Top 50% - 75% of all rated assets
- Tier 4 – Non Critical: Lowest 25% of all rated assets
Separation of these tiers is required to assign an appropriate level of additional analysis and the creation of asset risk control strategies. For highly critical assets, an asset-specific failure mode and effects analysis (FMEA) should be conducted to ensure all potential failure modes are evaluated, and that appropriate tasks are developed to address each failure mode. For moderately critical assets, a FMEA for each asset type should be conducted (e.g. centrifugal pumps, tanks, etc.). Each FMEA can produce the following risk control strategies:
- Predictive Maintenance (PdM): activities based upon a specific operating condition of the asset utilized to detect the onset of a failure prior to becoming a functional failure. These tasks would include risk-based inspections for mechanical integrity. An example of a PdM task is utilizing infrared thermography to detect an abnormally hot air handler fan pulley due to belt drive misalignment.
- Preventive Maintenance (PM): activities scheduled to be completed based upon a specific time or run-rate interval regardless of the asset condition. An example is changing air handling unit belts every six months regardless of wear.
- Operator Care: tasks conducted by operators during normal production such as equipment inspection, lubrication, or cleaning.
- Asset modification or replacement: a project to modify the design of an asset or replace it with new functionality to mitigate known risks.
- Spare parts stocking and/or online spares: this would involve adjusting the site spare parts stocking requirements or potentially installing an online spare for continuity of service.
The risk control strategy most often adopted for low-critical assets is original equipment manufacturer (OEM) recommended maintenance tasks. The effectiveness and level of control provided through these tasks must be evaluated to ensure it is appropriate with the rated criticality level.
For the non-critical lowest tier of assets, running the asset to failure is typically the appropriate strategy. However, specific review of potential safety, environmental or quality impact should be conducted to ensure these areas have an acceptable level of risk under this strategy.
Quality critical assets, regardless of tier, can be sorted and evaluated for additional operational and maintenance requirements. If an asset is determined to be overall non critical, but could have indirect impact to product SISPQ, post-maintenance requirements such as cleaning or sanitization may be appropriate. Also, management of change and commissioning/qualification (C&Q) procedures can reference the quality criticality rating for level of documentation and C&Q required.
Understanding Asset Criticality to Manage Risk
Risks to safety, quality and productivity are managed through asset risk control strategies, which are created based upon specific asset criticality and failure modes. High risks to all areas of the operation receive the most robust risk control strategies, while low-risk assets are run to failure. When risks to the operation are appropriately mitigated, unexpected production downtime is minimized. Building upon PSM and quality risk assessments by also evaluating the productivity impact is how to ensure all risks to the operation are understood and mitigated. A holistic risk-based asset management program improves operational stability and maximizes value from your physical assets, while also maintaining a high level of safety and quality compliance.
References:
- ASTM E2500-07(2012): Standard Guide for Specification, Design, and Verification of Pharmaceutical and Biopharmaceutical Manufacturing Systems and Equipment, www.astm.org.
- CCPS Guidelines for Risk Based Process Safety, American Institute of Chemical Engineers (AIChE) Center for Chemical Process Safety (CCPS), March 2007, www.aiche.org/ccps.
- ISO 14224:2006: Petroleum, petrochemical and natural gas industries – Collection and exchange of reliability and maintenance data for equipment, www.iso.org.
- ISPE Baseline Guide Volume 5: Commissioning and Qualification, International Society for Pharmaceutical Engineering (ISPE), First Edition, March 2001, www.iso.org.
David J. Mierau, PE, CMRP is a licensed Professional Engineer and Certified Maintenance and Reliability Professional with a broad range of technical and management experience within the pharmaceutical and biotech industries. He is a member of ISPE and the Society for Maintenance and Reliability Professionals (SMRP). David is currently a Senior Reliability Engineering Subject Matter Expert with Life Cycle Engineering providing asset management, reliability, root cause analysis, and engineering management consulting services. He can be reached at dmierau@LCE.com.
© Life Cycle Engineering, Inc.

For More Information
843.744.7110 | info@LCE.com