Determining an OEE Goal Based Upon Customer
Takt Time
By Rich Jansen, Life Cycle Engineering
As appeared in Uptime magazine
 Download the Uptime Magazine Reprint (PDF)
What is the basis for your current OEE Goal? Is it clear to you, and is it one which employees in the organization have a motivation to achieve? Regardless of how you get there, it all starts with building the awareness of the need for the targeted performance level. It is from this awareness that the desire/motivation can be developed. There are a variety of approaches for establishing your OEE goal, each with their share of questions which can limit the level of motivation.
- Is it based upon an industry benchmark? “But we are unique, and no one else does what we do.”
- Is it based upon a senior management directive? “They always just want more, and are never satisfied!”
- Is it based upon a popular, well-rounded number – like 85%? “But why not 86% or 87%. What is so magical about 85%?”
Because these approaches do not provide a clear answer to the question “Why?”, they are often not effective. What about a goal which focuses on customer satisfaction – like Takt Time?
So, you might say, “What is Takt Time?”. First you have to understand the word “Takt”, which is a German word meaning pace or rhythm. Takt Time means the pace, or rhythm, of the customer demand. The ability to match your production with your Takt Time requires mastering the art of making the right part, at the right time, in the right quantity. This concept is a key aspect of lean manufacturing, and building a connection to the customer is one way for rationalizing a goal which the general population can understand.
But first we need to understand the Takt Time value more clearly by understanding its formula shown below: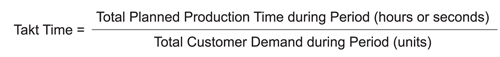
An actual example could be as follows: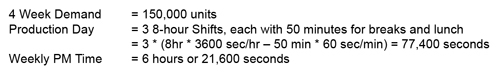
If you used all 28 days over the 4 week period, then the Takt Time (TT) would be: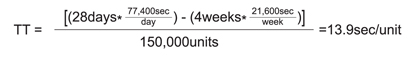
So we now know that the customer needs the production of one unit every 13.9 seconds. This is a goal which is easy to understand, but how does it relate to OEE?
OEE (Overall Equipment Effectiveness) is a representation of the operations performance which is composed of three Key Performance Indicators:
- Availability Rate (Breakdowns + Changeovers)
- Production Rate (Minor Stoppages + Cycle Time losses)
- Quality Rate (Rework + Scrap)
These OEE KPIs represented as loss factor percentages can be applied to the Target Process Cycle time to determine the actual Production Pace (PP), which is demonstrated in the following example.
Target Process Cycle Time = 10 sec/unit
OEE = 75% (or a 25% loss)
Availability Loss = 12% Breakdown + 8% Changeover
Production Loss = 3%
Quality Loss = 2%
PP = Target Cycle Time / OEE = 10 sec/unit / 75% = 13.3 sec/unit
Now we understand that, despite the 10 second cycle time, product is actually only produced at a rate of one unit every 13.3 seconds based upon the current OEE performance. At least this is faster than the customer demand of one every 13.9 seconds. By using these same basic formulas, and matching the Takt Time with the Production Pace, one can see that the customer demand requires 27 production days to produce with the current OEE performance.
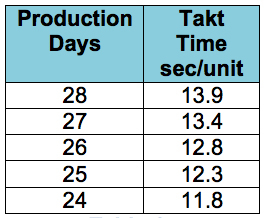
Table 1
Twenty-seven production days over four weeks means that the operation would be required to run six days per week plus three Sundays. This is the starting point for establishing a goal. For example, what about the goal to produce the required demand without the Sunday overtime? – i.e. in 24 days. Using the data from Table 1, this would mean a Takt Time of 11.8 sec/unit. By knowing that the Production Pace needs to satisfy the Takt Time, an OEE Goal can be established.
PP = Target Cycle Time / OEE
OEE = Target Cycle Time / PP
OEE = [10 sec/unit] / [11.8 sec/unit] * 100% = 85%
The OEE Goal of 85% means an OEE loss of 15% is required to achieve the customer demand in 24 days – a goal focused upon satisfying the customer. By understanding the OEE losses, a strategy can be established to achieve the business goal.
Based upon the loss factors for the example provided (visualized in Figure 1), the following strategy could be rationalized:
- Eliminate Cycle Time Losses
- Reduce Rework Loss by 50%
- Reduce Change-Over Loss by 50%
- Reduce Breakdown Loss by 30%
With this approach, the employees of the organization, working in teams to address these specific goals, can understand the basis for the individual goals that are being deployed. Respecting the employees by providing this understanding during the process of goal deployment can go a long way in determining if the goal is achieved.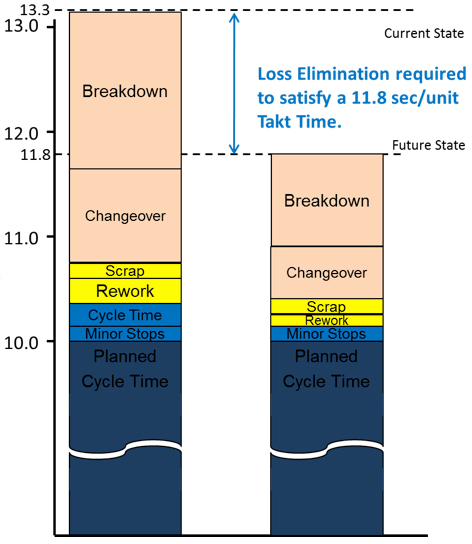
The value of the OEE metric is to identify the sources of losses which affect the ability to achieve the business goals – which leads to improvement strategies. Connecting the OEE Metric with the business goals keeps it aligned with a continuously improving organization, so there is no static number for a goal. Using the concept of Takt Time is one way to maintain the alignment with the business goals (goals which are aligned with satisfying the Customer).
Rich Jansen is a Reliability Engineering Subject Matter Expert with Life Cycle Engineering (LCE). Rich has over 20 years of experience in the automotive industry in the areas of Quality Engineering, Manufacturing Engineering, and Maintenance. Rich is a graduate of the University of Cincinnati with a Bachelor of Science degree in Mechanical Engineering. Rich can be reached at rjansen@LCE.com.
© Life Cycle Engineering, Inc.

For More Information
843.744.7110 | info@LCE.com
-->