Eliminating Defects through Equipment Reliability
Since the rise to prominence of quality-focused business initiatives such as Total Quality Management (TQM) and eventually Six Sigma, companies have been focusing on reducing their final product defects to the absolute bare minimum. The widely accepted definition of a Six Sigma process is one that produces 3.4 defective parts per million opportunities (DPMO). The single most critical item to this overall quality goal is variation. Many quality professionals readily acknowledge that variations in processes and in equipment performance lead to a vast number of defects experienced by the end customer. In Six Sigma, a defect is defined as anything that could lead to customer dissatisfaction. For the purposes of this article, the author’s focus will be on the correlation between equipment reliability and such product defects. This article will also explore some of the common root causes of poor equipment reliability and what can be done to prevent or mitigate them hence leading to the elimination of defects.
Equipment Reliability and Product Defects
Author, Ron Moore, suggests that process conformance can be improved through equipment reliability, proper, calibrated instrumentation, disciplined operation and quality raw material1. Equipment reliability assures that subsystems and components function as intended without failure for desired periods during their design life. Theoretically, defects can be introduced into equipment at each of the six main phases of its life cycle: Design, Purchase, Store, Installation/Commissioning, Operation and Maintenance. It therefore stands to reason that if one manages the defects leading to equipment failure, then one will be able to directly affect product quality.
Common Root Causes of Poor Equipment Reliability
Root causes are the underlying factors that are found to be responsible for a particular event or class of events occurring, such as poor equipment performance. The goal of eliminating these root causes is to prevent future recurrence of said event(s). Often these are mistaken with the human interventions that lead to failure, symptoms of failure or the physical mechanisms by which failure manifests itself. Rather, in order to truly prevent future unreliability, one must go to the true source of failures known as latent causes. These are systemic by nature and while they yield the highest reward by being prevented or managed, they are most at risk for non-implementation. This is due to the fact that they are by and large deep-seated in the organization and pointing towards the management system that has been ingrained in the company culture. Some of the more common latent roots that one can cite for premature equipment failure are:
- Misapplication2 - this can be due to equipment operations outside of the design envelope, poor initial design practices or poor procurement practices.
- Operating Practices2 - due to inadequate operating procedures, lack of adherence to procedures or inadequate system for follow up.
- Maintenance Practices2 - due to inadequate maintenance procedures, no adherence to procedures or inadequate frequency of maintenance tasks.
- Age2 - due to accelerated wear mechanisms by environmental factors or the end of the useful life by normal wear and tear.
- Management Systems - due to lack of skills or operator training, poor employee involvement, poor recognition of hazard, previously identified hazards were not followed up on and eliminated.
Any organization trying to reap the full benefits of reduced defects by improving equipment reliability should have at least the following four systems in place.
1 – RCA program
Root cause analysis (RCA) is a process which systematically uses any one or combination of a class of problem-solving methods aimed at identifying the root causes of problems or events. The stewardship of this process is usually a function of Reliability Engineering. As intimated earlier, having a disciplined RCA program in place is essential, first of all, to identify the reasons behind poor equipment reliability and secondly to implement actions which will prevent them from happening again.
Company A, a large chemical manufacturer, had over 1150 centrifugal pumps in service. The Mean Time between Failure (MTBF) for the pumps in 1995 was measured to be approximately 0.8 years (9.6 months). Systematic RCA as a business process did not start at the facility until 1998. Prior to that, they performed failure analysis and did a gap analysis between their installation and maintenance practices and “best in class.” That was the jumpstart that they needed. A formal RCA process came later. The decision was made by the reliability department to have their crafts/trades trained in a technique by which failure codes would be assigned for each failure. This data was subsequently recorded in their Computerized Maintenance Management System (CMMS) and a separate Failure Reporting Analysis and Corrective Actions System (FRACAS) database. RCA was conducted on what were determined to be the more predominant modes of failure (as indicated by the failure codes). Actions were then taken based on the findings and the results shown in figure 1 were achieved. 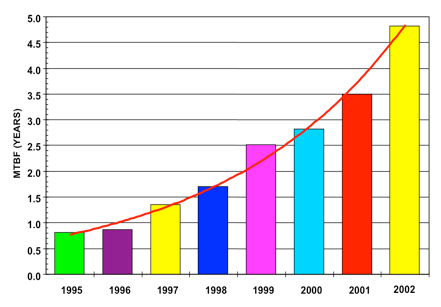
Figure 1: Pump MTBF for years 1995 - 2002
Over the course of eight years, the MTBF for these pumps increased by a phenomenal 500%. Just the reduction in pump failures accounted for approximately $5.5M per year reduction in direct maintenance cost by the end of the data set. There were many other reliability initiatives besides pumps going on during that last five years of the data period, but pumps were first and the largest. The combined impact of all the reliability initiatives (of which pumps were estimated to be accountable for 35% to 40%) was an uprating of the plant by 15% for essentially minor capital expenditures and an increase in OEE of approximately 4% (from 94% to 98.2%). The plant was able to debottleneck and operate at the higher demonstrated rate because of the increased process stability. More than three pump failures per day, even where there were spares, is a lot of instability. Throw in a few instrument failures per day and at least one vessel failure per week, and one never knew what the real limits of a plant were because one could never ‘line out” and run. The impact of the reduced cost and increased sales from all of the improvements made plant profitability go from $12M USD per year in a sold out market to $43M per year at only 60% of capacity to $72M per year when it was sold out the next year.
2 – Onsite Reliability Practitioners
Life Cycle Engineering is the pioneer of Reliability Excellence (Rx), which is defined as “a business philosophy, driven through cultural change that focuses on equipment reliability and process control as the foundation of modern manufacturing operations.” In the company’s experience, it has been determined that excellence is accomplished by the completion of five discrete levels referred to as the excellence model shown in figure 2. The sustainability step atop the model includes Reliability Engineering as one of its key components. Whether you have a Reliability Engineer onsite or not, there are some key activities within that role that need to take place in order assure that the desired results are sustained – the desired results in this case being increased equipment reliability leading to lower defects.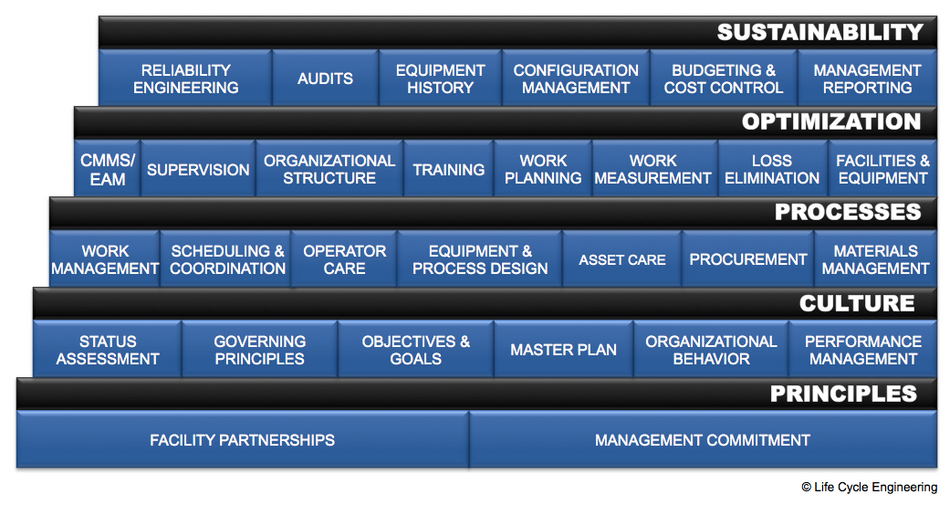
Figure 2: Reliability Excellence Model
Your onsite reliability practitioners are tasked to monitor equipment and processes in order to identify opportunities for continuous improvement. As risk managers for your business, they should proactively determine the best way to handle risk through the use of the appropriate preventive/predictive maintenance techniques and risk plans. Reliability Centered Maintenance or some variation thereof is recommended for at least the most critical equipment that you have onsite. For the balance of the plant, various other optimization strategies allowing the best bang for the buck can be utilized. It is advised, however, that one be cognizant of the limitations of such strategies in order to knowingly accept any risks associated with their use.
3 – Business Processes Supporting Reliability and Product Quality
The foundation of any reliability and quality initiative has to be stable processes. It must be fundamentally clear that no Total Productive Maintenance (TPM), Lean Manufacturing or Six Sigma initiative will reach its full potential without the processes to sustain improvement. Take for example, the case of a fifty year old Aluminum smelter, which undertook the mammoth task of reengineering their work and equipment processes. In 2002, just prior to their focused Reliability Excellence effort, the plant had total maintenance costs in excess of $35 million. It also had a ratio of more than $137 in maintenance costs for every metric ton of aluminum produced (50% higher than the global average at the time). The company embarked on standardizing work processes, developing equipment history and utilizing lean manufacturing tools for problem solving. Maintenance in partnership with operations, decided to use the TPM metric, Overall Equipment Effectiveness (OEE) to measure their progress. Peak performances for specific plant functions were determined, including scrap rate. In 2004, after implementing new reliability-based processes, $2.4 million in improvements were attributed directly to such OEE gains.
4 – Results Monitoring
The old adage attributed to quality professional, Joseph Juran which states, “If you don’t measure it, you don’t manage it”, still rings true today. To ensure that you are on the right track and achieving the desired results of no defects, one must have the appropriate metrics in place. The first obvious metric to consider is OEE. This measure indicates how effectively the organization’s assets are being utilized to achieve business goals. It integrates three other measures: equipment availability, performance rate and product quality. The fascinating thing about the use of OEE as a metric is that from this discussion, it has been established that by improving equipment reliability, the availability measure and the quality measure may also improve. There will then be a dual effect on OEE due to improved reliability. Another metric that would be useful to track is the MTBF and scrap rate on specific pieces of equipment that have been targeted for improvement. In so doing, the direct correlation between the two measures can be examined and further analyzed.
Conclusion
Frequently, reliability professionals articulate the connection between equipment reliability and the bottom line results that matter to most organizations. One will very quickly tout the connection with production output and safety but quality or process waste is sometimes left behind. As suggested in this article, there is a clear link between equipment reliability and the defects or waste created in the manufacturing process. In order to manage the variation in your manufacturing process, you need to manage the variation in the performance of your equipment by taking four key steps towards consistency in your product. First, you need a robust, disciplined RCA and reliability program in place in order to identify the sources of poor equipment reliability. Second, you also need to have reliability personnel dedicated to the tasks of sustaining your reliability improvements. Third, you need to understand your business processes and ensure that they support your direction. Lastly, you need to measure your progress with the appropriate metrics.
© Life Cycle Engineering, Inc.

For More Information
843.744.7110 | info@LCE.com