Failure Codes to the Rescue: A Reliability Engineer’s Experience with an Unsuccessful FMEA
I was recently asked to perform a Failure Mode and Effects Analysis (FMEA) at a large food processing facility. This piece of equipment was similar to about 40 other assets and we were excited about being able to leverage this FMEA as a template. Furthermore, we were going to be able to extend this to other facilities that this client operated across the country.
Conducting an FMEA would include these basic steps:
- Constructing a Functional Block Diagram to provide a simplified schematic of the asset. This describes each subsystem and component and how they are related to and interact with each other.
- Creating a list of the asset’s functions and then the team defines what constitutes a functional failure. This forms the basis for identifying failure modes, effects and causes.
- Performing a risk assessment on each of these failure modes, assessing the severity, likelihood of occurrence, and detectability of the failure mode. Each risk is assigned a Risk Priority Number (RPN).
Conducting the FMEA leads to more questions
Working with the company’s subject matter expert, I identified 118 failure mode/causes for this asset. We felt we had defined a pretty rigorous criteria for mitigation of risks: any Risk Priority Number (RPN) higher than 24 on a 1-125 scale. After three long days of analysis, we only identified eight risks that exceeded the criteria. And those eight only had an RPN of 30. Six of them involved risks created by external sources such as the cooling tower or plant instrument air compressor.
Earlier that week I had asked the question: why did we select this asset for an FMEA? The answer was not clear, as many of the decisions about the project had been made by corporate management in another state. It became clear after completing the FMEA that this was not a critical asset. As we graded each risk, most of the production loss consequences were assigned a 2 on a 1-to-5 Severity Scale (5 being the highest). Furthermore, the equipment was not required to be utilized seven days a week. With a five-day a week, two-shift production schedule many failures could be tolerated from a production downtime standpoint.
While the FMEA was somewhat disappointing, we wanted to unravel the mystery of why the asset was chosen for scrutiny.
Looking for answers with a Maintenance Cost Analysis
To probe a little bit more, I scheduled a conference call with local plant management and corporate management. The perception was that this asset was too expensive to maintain. The sample of work order cost data we were provided on one of the 40 assets did not support this. It was one of the newer assets in the family, though. Based on the FMEA and a three-hour tour of the asset location where I interviewed key production floor and maintenance personnel, I suspected a number of possible explanations.
- This was a large family of assets. Even though failure rates per individual asset were acceptable from a plant risk perspective, the total aggregate cost was a large dollar figure.
- These were large, complex, older-vintage machines that were expensive to maintain due to normal wear and tear, even on a mostly planned and preventive basis.
- Because most of these assets were old, some obsolescence replacements were being subsidized by the corrective maintenance budget.
- Corrective maintenance costs may be hidden in PMs. Most plants prevent this with rules requiring a separate work order to be created if the corrective actions found on a PM exceed a threshold, like 15 minutes or $500.
- Equipment-specific charges were being charged to the general function location. These charges are easily spotted with such catch-all descriptions as “General Maintenance” or “Miscellaneous Area 19 Repairs”.
- The PM strategy may be more robust than it needs to be, given the Overall Equipment Effectiveness (OEE) or Asset Utilization requirements, resulting in excessive labor.
I next turned to work order data in SAP® [i] to help verify or rule out the possibilities. A query of work orders for the past five years yielded a mountain of information. The plant had written 158,000 work orders. The metrics that were being run were “the usual suspects”: Cost by Area or Function Location, Cost by Work Order Type, and Cost by Equipment Number. While this would seem to point one in the right direction, it was muddied by the vast amount of work that was charged to general function locations or to general maintenance. And it didn’t tell us specific causes of the costs.
The area where this family of assets resided contained 5,100 work orders out of the 158,000 total. It also accounted for about 10% of the maintenance dollars spent in the whole plant. So we were researching a worthwhile candidate.
I decided to filter out work orders less than $1,000. Many low-value work orders shouldn’t be ignored because they result in low schedule efficiency due to the time waiting for work permits, travelling from job to job, and administrative processing of work orders. But my goal here was to identify high-value failures that the client could assign a reliability engineer to solve. At this plant, there were no official reliability engineers. This was a hat worn by the maintenance manager. This is common at many facilities I visit. At best, the reliability engineers that do exist are spread very thin. In my case, I had two days to sort through this data before my out-brief report to the client was due.
This turned out to be a good strategy because it turned out that 15% of the work orders accounted for 72% of the cost. I had narrowed my list to a few hundred orders. Scanning through descriptions of the work orders was now a much easier task. I assigned them categories like “Mechanical”, “Instrument and Electrical” and “Safety”. I then sorted by category, and scanning the Mechanical orders I identified other trends such as “Gearbox”, “Rotary Valve”, “Chain Drive” and so on. There were a few that I could not figure out without asking someone who worked on the asset daily, but at this point it didn’t matter that much.
I narrowed it down to the top 10 “bad actors”. At first glance, these seemed to account for a huge chunk of money and it appeared we had found the “smoking gun”. But after some simple calculations I determined that the Mean-Time-Between-Failure (MTBF) for each component was about five years. While improvements could always be made, this was not bad for an asset that operated in a relatively harsh environment (for machinery life, that is). For the most part my first two possibilities were the correct ones:
- This was a large family of assets. Even though failure rates per individual asset were acceptable from a plant risk perspective, the total aggregate cost was a large dollar figure.
- These were large, complex, older-vintage machines that were simply expensive to maintain, due to normal wear and tear, even on a mostly planned and preventive basis.
One interesting side note: the catch-all work orders were accounted for by a handful of maintenance technicians who were allowed to charge all of their time to one work order for the week. In contrast, some technicians were conscientiously distributing their time to as many as 25 work orders per week.
SAP Failure Codes to the Rescue
While my impromptu analysis allowed me to provide a valuable explanation to the client despite the “failed” FMEA, performing late-night manual analysis of work orders is not the most effective use of a reliability engineer’s time. There are a couple of useful data fields in SAP that don’t take a lot of time for maintenance (or production technicians) to fill out and automate part of the reliability engineer’s Pareto analysis of bad actors.
When a work order is created in SAP it can be done in one of two ways. A work order can be created directly with minimal basic information such as cost center, order type, and short text description. This allows parts to be ordered, time to be charged, and basic cost to be tracked. If maintenance technicians are diligent, they will sometimes add a long text description that describes the nature of the failure in more detail. Hopefully this will also include a discussion about what the cause of the failure was or might have been. This doesn’t need to be a cause-and-effect root cause investigation with forensic evidence; any information the technician can provide is certainly helpful.
This approach still relies on manual review of every work order by a reliability engineer to spot any trends or establish a bad actor list. If there are five or 10 or 200 work orders this is not such a chore. But some facilities process up to 25,000 work orders per month and there is no way a reliability engineer can keep up with that and the multitude of other requests for his or her time.
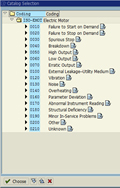
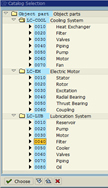
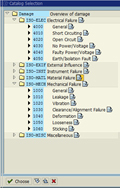
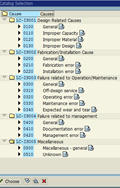
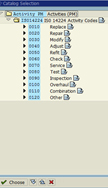
A better way to create a work order is to convert it from a work notification. The work notification contains several fields that allow for input of useful information by the production or maintenance technicians. This information is more generically referred to as the Notification Item(s). In our case, we are interested in the fields called Coding, Object Part, Damage, Cause, and Activity. There are places to enter long descriptions next to most of these fields, but the key feature is that the entries are limited to one or two-word standardized descriptions called Failure Codes. Ideally these are prepared and approved by engineering at a corporate level to ensure consistency across the enterprise.
|
Coding |
Object Part |
Damage |
Cause |
Activity |
|
|
|
|
|
|
|
|
|
|
|
|
Some of this information cannot be entered until after the corrective work is completed, but SAP allows the maintenance technician to quickly jump from the Time Confirmation screen of the Work Order to the Notification with the click of a single button.
Often I see plants that have taken the time to create a detailed list of Failure Codes, but they are not using them. It would be easy to assume that maintenance technicians are just lazy, not willing to participate in the reliability effort, or don’t have a good understanding of SAP. While some of these things may be true, often the real problem is that the list is too long and cumbersome to encourage regular use. If a maintenance technician has to scroll through a list of 250 cause codes that apply to all disciplines just to find Cracked Seal Face, and also decide that Dry Run Seal Face was not the correct code, it won’t be long before the effort is abandoned.
The solution to this is the Catalog Profile in SAP, where engineering calibrates the Code choices with the appropriate Equipment Types. Then, when a maintenance mechanic selects Pump for the Reference Object , he only has Cracked Housing, Blocked Outlet, Corroded Fitting, etc. to choose from and cannot select Burned Up Windings, Water in Transmitter, or Excessive Voltage. This takes a little more effort up front by engineering, but is usually rewarded when technicians begin to willingly populate notifications.
Once we begin to populate Notifications with Failure Codes, a report can be run weekly or monthly to automatically generate a bad actor list. This is really powerful when 15,000 work orders can be queried and in seconds the reliability engineer knows what the most important issues are. Some more investigation may be required to further define the exact root cause of the problem, but at least we are working on the right problems. Also, the technicians will be encouraged when they see the reliability engineer making use of the information that they took the time to enter. In the end, the extra time invested in entering Failure Codes is not really extra time when your maintenance and reliability programs emerge from reactive to proactive.
[i] SAP is the registered trademark of SAP AG in Germany and in several other countries.
© Life Cycle Engineering, Inc.

For More Information
843.744.7110 | info@LCE.com