Realizing the value of risk-based management
 Download Reprint of Realizing the value of risk-based management (PDF)
Operators can derive the best results by collecting relevant data from the value stream, and using it to make fiscally responsible decisions.
Asset management has been redefined in many ways over the years, and typically has a financial feel to it. It is important to differentiate between an enterprise asset management system, and the strategy and plan that helps us manage our assets across the enterprise. It is also important not to confuse enterprise resource planning with enterprise asset management, since they relate to software-driven solutions. The key to asset management is to achieve the greatest return on net assets. The value of risk-based asset management is to achieve that return at the lowest total cost of ownership possible. Although management information systems and enabling technologies provide key elements of a risk-based asset management system, there is no silver bullet.
Developing a management plan that accounts for risk, and therefore cost, brings a significant advantage to the bottom line. Asset management itself is a basic corporate responsibility, and yet no real standards exist. The British Standards Institute has collaborated with the Institute of Asset Management to develop Publically Accepted Specification 55, which illustrates that some fundamental blocking and tackling up front is required to ensure that we have the foundation to leverage all the information available. In turn, this information will enable us to make the right decision based on value to the company. This is the “transparency” that these various systems taught.
The fact of the matter is, the corporate objectives, business process, systems integrations, and lack of clarity in fully understanding our limiting factors prevents us from optimizing asset performance. This has never been more important than now, when some downstream companies are looking to reduce as much as $900 million from their capital spend. The methodology presented here is an attempt to clearly define the steps we need to put in place to provide that foundation.
Value stream mapping
Value stream mapping documents the material and information flow from inception to disposition of product through each step of the process, with defined parameters captured to trend performance. In oil and gas, this map is more often referred to as the energy value chain, but relates directly to functions and processes of production, transportation, distribution, conversion, and end use as energy moves upstream.
Value stream mapping is a great activity to understand where the value lies in a sequential process flow, and is the first step in waste elimination. But it also provides two additional features in our riskbased asset management strategy development: the performance measures at each process, and the logical approach to hierarchy. No matter if we are using value stream mapping, process flow charting, or some other lean or industrial engineering tool, the idea here is that we clearly define each process in a logical manner that has a set of design specifications that we can use to identify trends. Once we accomplish this, we can develop a logical sequence to catalog our assets. Figure 1 shows an example of process flow from a gas well to the customer.
Before we develop the taxonomy of our oil rig, refinery, pipeline, etc., we must first define the asset types or classes, the common nomenclature to define them, the minimum attribute data that we will collect for them, and then build our hierarchy to that point, the lowest maintainable component. Multiple hierarchies may exist, especially when you consider distributive systems such as electrical power. When evaluating linear assets like pipelines, GIS networking should be considered.
Figure 1. Example of process flow from a gas well to the customer.
Asset taxonomy
Once we have cataloged our assets in a taxonomy like that outlined in Section 8.2 of ISO14224, Petroleum and natural gas industries—Collection and exchange of reliability and maintenance data for equipment, we then focus on developing the methodology for applying a criticality analysis to our assets. This should involve a cross-functional team of stakeholders in the value stream. The benefit of the value stream mapping and defined taxonomy will quickly be realized during this process.
When developing our method for applying criticality, it may be wise to first look at the system level or what is routinely considered level 5. This will then allow us to prioritize the systems to apply a more thorough analysis to level 7, or the component or asset level. Some of the key contributors to this analysis should be impact to corporate objectives, replacement asset value, impact to value stream, impact on reputation, single point failure, and impact on EHS regulations and requirements.
The overarching principle regarding equipment criticality analysis is that it should align with corporate objectives, and be accepted as the method to assign priority. A strategy must be selected to establish a criticality scale. The best practice in establishing this scale is to have both a qualitative and quantitative dimension to leverage both the experience of seasoned professionals and that of published standards and specifications for our industry. This will allow qualitative assessments to be validated by quantitative industry data. From here, characteristics of the criticality scales can be determined. Each characteristic should then be weighted using a scale from 0 to 10 to identify significance to the business. The greater the scale, the easier it will be to accurately identify “critical” assets. However, the total score possible should not exceed 100. By setting a limit of 100, you are reinforcing the “weight” of each characteristic. Table 1 shows an example of such data.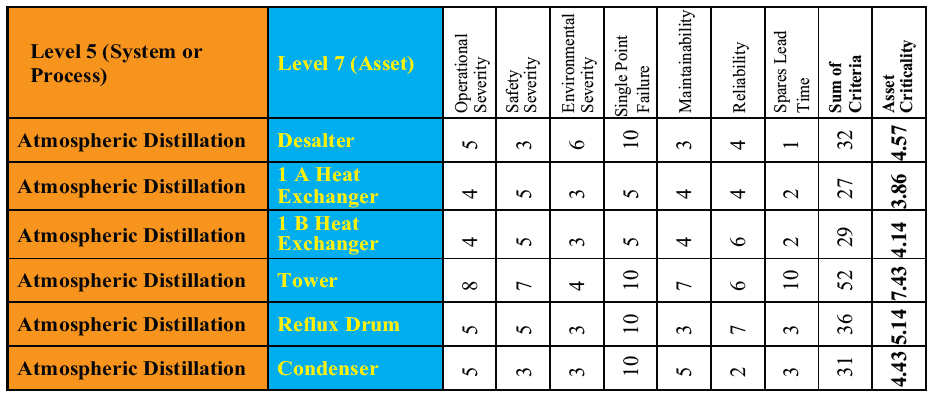
Table 1. Weighted criticality scale for various assets.
Priorities and risk ranking
Establishing an equipment criticality will allow us to establish the priority to which risk ranking can be applied. A risk table or some other risk analysis method can be used to then perform risk analysis. Two widely accepted methods are the quantitative risk assessment and the risk assessment matrix.
The quantitative risk assessment uses failure rate data to develop mean time between failure probabilities for specific asset types or classes. There are software companies that will sell you accelerators or tables for generic asset types, much like those tables used by the companies selling life insurance. But just as in dealing with health, the data does not directly correlate to a specific facility or industry, nor does it take into account the specific operational envelope of the equipment. Further analysis is required, much like that of the physical exam required prior to receiving coverage.
Another option is to develop this data in-house. Although extremely tedious, it is possible to collect this data, but best practice work order processes and their execution, along with reliability analytics, are required to collect relevant historical data. ISO 14224 attempts to drive a common methodology to record and catalog such data throughout the oil and gas industry. However, the level of detail is somewhat lacking for linking predominant failure modes to lowest maintainable level for identification of limiting factors. Therefore, it is extremely important to put proper controls in place to mitigate or eliminate these factors. With proper historical data available, this method may be used to for risk assessment. If not, professional expertise must be utilized to facilitate this practice.
Another common practice is to apply a risk assessment matrix to the asset catalog. This helps determine the severity and occurrence of failure impacting that particular piece of equipment. In turn, this step provides a screening of failure and the potential impact, according to the respective level of risk. It also provides a traceable record that all have been identified and assessed. This matrix also provides an input into decision making on how corporate resources will be applied to improve safety or lessen the uncontrolled release of environmental or health hazards, by highlighting those which pose the highest risk. This also adds significant value early on in the application design review of a capital project involving a new plant, new processes, or changes to existing processes. The matrix provides a decision-making tool to determine which hazards within the design consideration should be given to alternate methods or additional controls in order to reduce the level of risk.
Developing a grading matrix
The risk assessment uses a risk severity and likelihood of occurrence to provide a grading matrix. From the combination of severity and occurrence, a risk level can then be defined as high, medium, or low. This risk level is then used in combination with the criticality analysis to create a risk ranking.
This risk ranking is then used to define what level of failure analysis will be performed. Reliability centered maintenance is a proven and very meticulous method to answer the following questions:
- What are the functions and associated desired standards of performance of the asset in its present operating context? (Functions)
- In what ways can it fail to fulfill its functions? (Functional Failures)
- What causes each functional failure? (Failure Modes)
- What happens when each failure occurs? (Failure Effects)
- In what way does each failure matter? (Failure Consequences)
- What should be done to predict or prevent each failure? (Proactive Tasks and Task Intervals)
- What should be done if a suitable proactive task cannot be found? (Default Action)
It is not possible due to resource constraints and significant investment to perform this level of analysis to each asset within the master data file. Therefore, risk ranking can be used to determine the analysis to be put in place to provide the most cost-effective deterrent or detection method for managing our assets.
Processing information
Once the predominant failure modes are identified, the control or management to eliminate or mitigate that failure is then defined to reduce the risk. Insulated carbon-steel piping may have a time-based inspection to take core samples for chlorides, or process intelligence of a process line may be used to trend asset health. No matter what the strategy, it is important that the processes are mapped and the interfaces are identified. A system can quickly be overwhelmed without clearly defining requirements and supporting the management of information. Monitoring systems are being installed within the energy value chain that can process and transmit as much as 80 gigabytes of data an hour.
When mapping our control solution, we must take into account all the require operational integration of systems not only to ensure accurately leveraging the intelligence, but also to understand the possible security vulnerability of this data and possible control. Now more than ever, our reliability and operations professionals must join with our information technology professionals to ensure the security of our interfaces – from the hard assets like pumps and compressors; to programmable logic controllers; to the distributed control system; to our process intelligence, then to our enterprise asset management system; and finally all the way up to the general ledgers and balance sheets managed within our enterprise resource planning application. Consider that each time we purchase a vibration monitor, install a sophisticated piece of equipment, invest in a best-in-breed enterprise asset management system, or purchase a program to manage our mechanical integrity program, we add another layer that must be modeled or integrated into its appropriate level, using a method such as the Purdue Model for Process Control (Figure 2).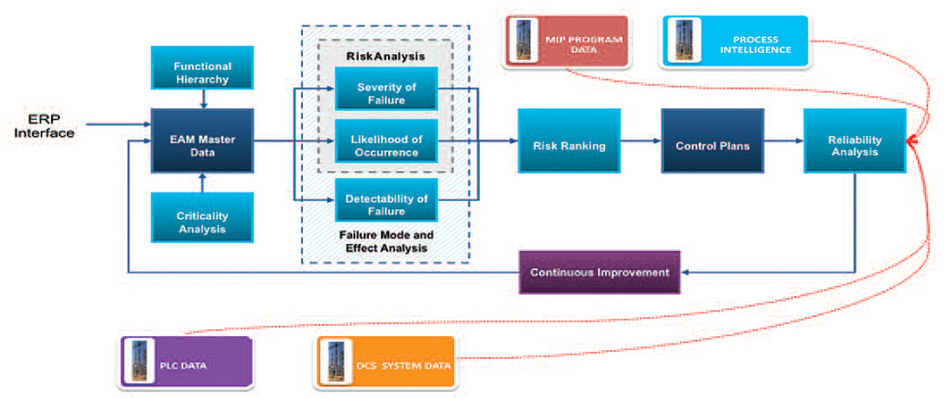
Figure 2. When considering a purchase or adding a new piece of equipment, planners must realize that another layer that must be modeled or integrated into its appropriate level.
Unfortunately, most companies lack the experience, and do not fully understand the benefit and the threat of not properly integrating these applications. Help is on the way, though, as organizations like MIMOSA work to drive open information standards for the asset management life cycle. It is also important not to overlook the importance of the human element of risk and asset management. Without a clear understanding of the importance of adhering to the established strategy by fostering a culture of continuous improvement, and having performance-based incentives to ensure that proper behaviors are prevalent, the corporate culture required to sustain the change to adopt and embrace this approach will fall short.
Conclusion
Fundamentally, a risk-based asset management system is nothing more than common sense. Collect relevant information based on importance to the value stream, and use this information to make fiscally responsible decisions that will in turn create greater value to the organization.
© Life Cycle Engineering

For More Information
843.744.7110 | info@LCE.com